You have no items in your shopping cart.

Data Visualisation and Dashboard
Data visualization refers to the presentation of data in a graphical or visual format to help people better understand and interpret it. The purpose of data visualization is to communicate complex data and insights quickly and effectively.
A dashboard is a type of data visualization tool that displays a summary of key performance indicators (KPIs) and metrics on a single screen. Dashboards can help businesses make better decisions by providing a quick and easy way to monitor performance, identify trends, and track progress towards goals. They are often used in business intelligence, analytics, and reporting to provide a snapshot of important data at a glance. Dashboards can be customized to show specific metrics and can be designed to be interactive, allowing users to drill down into specific data points for more detail.
Our Data visualization and dashboard courses are designed to teach individuals how to effectively present and communicate data using graphical and visual tools. These courses can range from beginner-level courses that cover the basics of data visualization to advanced courses that teach advanced techniques for creating interactive dashboards. In these courses, students can learn how to choose the right type of chart or graph for their data, design effective visuals, and interpret the results. They can also learn how to use tools such as Tableau, Excel, or other data visualization software to create dynamic and interactive dashboards. Our Data visualization and dashboard courses can be beneficial for individuals who work in a variety of industries, including business, finance, healthcare, and marketing. These skills are in high demand as businesses seek to gain insights from their data and make data-driven decisions.
-
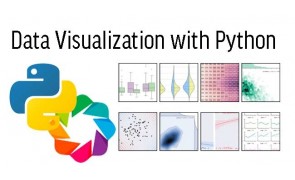
Data Visualisation with Python Training
Step into the immersive realm of Data Visualisation with Python Training. Python, renowned for its versatility, has firmly established itself as a stalwart in the data visualization domain. Our meticulously crafted course is designed to take participants from the foundational principles of crafting basic plots using Matplotlib to the refined techniques and aesthetics offered by Seaborn, encapsulating the best of Pyth....$300.00 (GST-exclusive)$327.00 (GST-inclusive) -
Data Visualisation with Google Data Studio
With basic knowledge of Google Data Studio, you can turn any information into sleek data visualizations full of meaningful insights. But Data Studio offers a special bonus for marketers: easy access to data sets from the entire Google Marketing Platform and social media sites such as Facebook and Twitter. In this course, you will learn how to create your own engaging and interactive dashboards to track marketing cam....$300.00 (GST-exclusive)$327.00 (GST-inclusive) -
Data Visualisation with R Training
Embark on a transformative journey into the realm of data visualization with "Data Visualisation with R Training". R, a versatile statistical programming language, offers a broad array of tools and libraries for crafting insightful visual narratives from data. Our course takes participants from the rudiments of creating basic plots in R to the advanced realms of ggplot2, unveiling the potential of data visualization ....$300.00 (GST-exclusive)$327.00 (GST-inclusive) -
Creating an Interactive Excel Dashboards for Business Analytics
Elevate your proficiency in business analytics by mastering the creation of interactive Excel dashboards. This comprehensive course guides participants from the initial stages of defining requirements and setting up data, to more intricate processes such as importing data, inserting slicers, and diving into the intricacies of VBA code. Emphasizing hands-on learning, participants will delve into practical exercises, e....$300.00 (GST-exclusive)$327.00 (GST-inclusive) -
WSQ - Microsoft Power BI Data Analyst Associate (PL-300)
This course is designed to prepare students for the Microsoft Power BI Data Analyst (PL-300) certification exam. The course covers all the topics that are necessary to become a proficient Power BI data analyst, including data modeling, visualization, report creation, and dashboard design. The course begins with an introduction to Power BI and its various components. Students will learn about data sources, data model....$1,200.00 (GST-exclusive)$1,308.00 (GST-inclusive) -
Advanced Power BI for Business Analytics
Power BI is a business intelligence and analytics platform that helps users collect, organize, and analyze data. The software relies on Microsoft Excel, making it easy to use without any additional training or equipment. It can be accessed through the web or downloaded to your computer and synced with the cloud. Power BI ranks as a leader in the business intelligence and analytics platforms category. This course wil....$600.00 (GST-exclusive)$654.00 (GST-inclusive) -
Basic Microsoft Power BI Training
Unlock the power of data visualization and reporting with our Basic Microsoft Power BI Training at Tertiary Courses. This course is meticulously designed to introduce learners to the core aspects of Power BI, from crafting detailed reports using Power BI Service to transforming raw data into insightful visuals with Power BI Desktop. Deepen your analytical skills as you navigate the Power Query Editor, ensuring seaml....$298.00 (GST-exclusive)$324.82 (GST-inclusive) -
Power BI Business Analytics Training
Power BI ranks as a leader in the business intelligence and analytics platforms as recognised by Gartner. The suite is a collection of software services, apps and connectors that work together to turn your data into coherent, visually immersive and interactive insights. Power BI lets one connect easily to data sources, visualise (or discover) what is important and share that with anyone or everyone one wants. It can....$498.00 (GST-exclusive)$542.82 (GST-inclusive) -
Full Tableau Training
Embark on an enlightening journey into the realm of Tableau, a leading tool for data visualization and business intelligence. This Full Tableau Training is meticulously designed to bridge the gap between data potential and actionable insights. Learn the intricacies of Tableau Worksheets, harness the dynamism of Tableau Dashboard & Story, and delve deep into data organization techniques such as Filters, Groups, an....$498.00 (GST-exclusive)$542.82 (GST-inclusive) -
Data Storytelling with Tableau
Unlock the power of data-driven narratives with our Data Storytelling with Tableau course. This program commences by focusing on the essentials: designing compelling storyboards that lay the groundwork for effective data communication. Our expert-guided training ensures that participants not only understand but also skillfully apply various storytelling techniques to make their data speak volumes. Beyond mere theory....$298.00 (GST-exclusive)$324.82 (GST-inclusive) -
Basic Tableau Training
Unveil the transformative power of data visualization with our "Basic Tableau Training" course. As an increasingly essential tool in the contemporary data landscape, Tableau offers unparalleled capabilities to convert raw data into insightful visual narratives. Our meticulously designed course introduces participants to the foundational aspects of Tableau, including connecting to data sources, merging and joining dat....$298.00 (GST-exclusive)$324.82 (GST-inclusive) -
IBF - Data Storytelling and Visualisation for Finance Services
Transform your financial data into compelling narratives with our IBF-STS Data Storytelling and Visualisation with Tableau for Finance Services course. Designed for finance professionals, this course teaches you how to utilize Tableau’s powerful visualization tools to simplify complex financial data. Learn to create interactive dashboards, charts, and graphs that make data easily interpretable, aiding in data-d....$800.00 (GST-exclusive)$872.00 (GST-inclusive) -
WSQ - Data Analytics and Visualization with R
Master the art of transforming raw data into actionable insights with our WSQ-endorsed course in Data Analytics and Visualization with R. This comprehensive course covers everything from basic data manipulation in R to advanced visualization techniques. You'll learn how to prepare datasets, create compelling visuals, and make data-driven decisions. The curriculum also includes real-world projects to ensure you get th....$688.00 (GST-exclusive)$749.92 (GST-inclusive) -
WSQ - Data Analytics and Visualization with Python
Expand your knowledge in data analytics and visualization with our WSQ-endorsed course focused on Python. Dive into key topics like data manipulation, statistical analysis, and visualization techniques using Python's powerful libraries. Through practical exercises and real-world examples, you'll learn to transform raw data into actionable insights and visual narratives that are compelling and easy to understand. By ....$688.00 (GST-exclusive)$749.92 (GST-inclusive) -
WSQ - Data Analytics and Visualization with Power BI
Dive into the world of data analytics and visualization with our comprehensive WSQ-endorsed course on Power BI. This course is designed to teach you how to turn complex data into compelling visual stories. You'll learn to navigate the Power BI interface, connect to various data sources, and create interactive dashboards. Practical exercises and real-world examples are integrated into the curriculum, ensuring you'll g....$800.00 (GST-exclusive)$872.00 (GST-inclusive) -
WSQ - Create Interactive Dashboard Using Excel
Master the art of dashboard creation with our WSQ-endorsed course focused on using Excel for interactive data visualization. The course covers essential skills such as utilizing pivot tables, incorporating various data sources, and applying advanced Excel functions. With hands-on exercises and real-world examples, you'll gain practical know-how that can be immediately applied in your work or business. Upon completin....$350.00 (GST-exclusive)$381.50 (GST-inclusive) -
WSQ - Data Storytelling with Tableau
Embark on the fascinating journey of turning raw data into meaningful stories with our WSQ-endorsed course on Data Storytelling with Tableau. Learn how to craft compelling narratives by leveraging Tableau's suite of data visualization tools. Our course covers techniques like contextual data representation, storytelling with dashboards, and how to utilize various visual elements for impact. Hands-on exercises and case....$688.00 (GST-exclusive)$749.92 (GST-inclusive) -
Infographics and Data Visualization with PowerPoint
This course is not yet approved for WSQ funding Learn the essentials of creating compelling infographics using PowerPoint in this focused course. Starting with an introduction to the various types of infographics, you'll discover how to plan and extract insights that drive data-informed decisions. This module covers the foundations, including what infographics are and how they can be effectively used to summarize co....$350.00 (GST-exclusive)$381.50 (GST-inclusive) -

PL-300 Microsoft Power BI Data Analyst Exam Prep
This course is designed to prepare students for the Microsoft Power BI Data Analyst (PL-300) certification exam. The course covers all the topics that are necessary to become a proficient Power BI data analyst, including data modeling, visualization, report creation, and dashboard design. The course begins with an introduction to Power BI and its various components. Students will learn about data sources, data model....$600.00 (GST-exclusive)$654.00 (GST-inclusive) -
WSQ – Data Visualisation with Tableau
Unlock the capabilities of Tableau for visual storytelling in our comprehensive WSQ-endorsed course. We cover everything from the basics of data import and cleaning to crafting advanced interactive dashboards. You'll learn how to use Tableau's extensive set of tools through hands-on exercises and real-world examples, ensuring you acquire practical skills to transform raw data into insightful visual narratives. By th....$688.00 (GST-exclusive)$749.92 (GST-inclusive)


 Approved Training Provider")